Fractals seems to be the subject
that the whole computer world is talking about at the moment and
this article by Peter Coates provides you with the background to the
fascinating world of fractals and gives hints on how you may write
your own fractal generating program on the Atari.
Readers of Page 6 may have come across graphical representations of
fractals in a variety of forms - the artificial landscapes generated
in some games programs, trees used as examples of recursion, and the
colourful and complex patterns employed to demonstrate the graphics
capabilities of modern micros. In this article I will be concerned
with the last group, as these have the greatest variety of complex
and attractive patterns. They are usually associated with the name
of Benoit Mandelbrot, who did much to publicise them. For some
outstanding examples of fractals, the reader is advised to beg,
borrow or steal (not really!) a copy of his book 'Frontiers of
Chaos'. I will also show you how to program your computer to
generate these patterns.
It is not generally realised that
fractals arose from a branch of abstract mathematics which studies
the chaotic behaviour of some functions. By this I mean that the
value of one of these functions will change dramatically for quite
small shifts in the value of one of the variables. This behaviour is
quite different from that of the classical functions of mathematics,
whose values in general change smoothly and continuously. A
geometrical example of a fractal often quoted is the coastline of an
island. If asked to determine its length, we might take a map of the
island and measure the length of the perimeter. If we found a map on
a larger scale and repeated the exercise, we would obtain a greater
value, because small inlets and corrugations not present on the
first map have to be taken into account. As the scale is magnified,
the length continues to increase, and eventually we have to add in
the contributions from rocks, pebbles and even grains of sand.
Moreover, as we do this, we would notice an interesting fact;
whatever the level of magnification, the sections of coastline being
measured have similar shapes, with unresolved detail waiting to be
exposed.
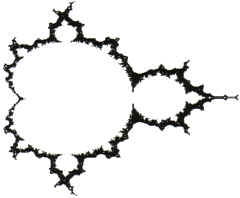
The Mandelbrot Set
A coastline is a simple example of a
fractal, but it illustrates the point that forms in nature are often
much more complex than the simple shapes of classical geometry.
However, even the complex fractals of Mandelbrot may be generated
with a relatively simple computer program, and I will now describe
how to do this. It should be emphasized that the technique given is
only one example, and that there is plenty of scope for
experimentation with other functions and methods.
We consider the effect of a simple
process applied repeatedly to a complex number which initially
represents the position of a pixel (i.e. a picture element) on the
screen. A complex number z is given by
z = x + i*y
where x and y are the horizontal and
vertical coordinates of the point, and i is the square root of -1.
If you are not addicted to complex numbers, don't worry, as the
calculations will all be given in terms of the real numbers x and y.
The process we shall use here is given mathematically by
z(k+1) = z(k)² + c
where c is a
complex constant
c = p + i*q
In words, this equation says that we
form the next (k + 1)th term in the sequence from the preceding one
by squaring it and adding the constant c. What is likely to happen?
Clearly, if both z and c are small, successive terms will quickly
become very small. Equally, if z and c are large, then the terms
will increase very rapidly. In the regions between, the terms may
wander around for some time before deciding whether to become small
or go off to infinity. The magnitude m of a complex number, by the
way, represents its distance from the origin and is given by
m² = x² + y²
To generate a fractal pattern,
therefore, we count the number of times that the process must be
applied to the initial value before m² for the term z(k+1) exceeds
a specified value L. As it may be shown that, once m has exceeded 2,
the magnitude increases rapidly, convenient values for L lie between
10 and 100. Also, as some points stay small in magnitude and will
never exceed the limit, and we don't want to spend for ever looking
at them, we terminate the process after a given number of
repetitions, k. The number of repetitions counted, k, can therefore
take values for each point from 1 to the upper limit k. To colour
the pattern, we relate k to one of the available colours on our
output device with what we may call a colouring rule. For example,
we might colour values of 1 to 10 as blue, 11 to 20 as orange, and
so on. The rule is quite arbitrary, and may be varied to improve the
appearance of the fractal obtained. Although the more attractive
patterns are obtained with high resolution graphics with many
colours, such as may be achieved with the new Atari ST machines, I
hope the examples provided with this article, produced on my old
800, show that interesting patterns may be generated in black and
white. I output the patterns directly to my Kanga NLG printer to
achieve higher resolution than that available on the screen.
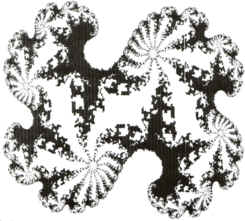
Sea Creature
At this point, I shall complicate the
issue a little (or even further, I hear you say!) by pointing out
that two types of fractals may be generated with the procedure
described. The Mandelbrot set is obtained by setting the first term
of the sequence equal to zero, and relating the constant c to the
point being coloured by
p=x;q=y
The Julia set, on the other hand, is
obtained by setting the initial value
z(0)=x+i*y
and assigning c a value which is
fixed for the whole pattern. The differences between the two in
practice are that in the Mandelbrot set we may change not only the
position but the magnification, and this gives a very great variety
of complex patterns, while the Julia patterns, on the other hand,
are plotted over the whole of the range of interest, i.e. x, y =
-1.5 to +1.5, and only the value c is changed.
However, the Julia set possesses a
degree of symmetry which I find attractive, and requires lower
numerical resolution. All the examples shown come from the Julia set
and were plotted using a FORTH program with 16-bit fixed point
arithmetic, which is considerably faster than Atari BASIC.
The first printout shows the whole of
the Mandelbrot set, with a horizontal range for -1.7 to 0.5, and
-1.1 to +1.1 vertically. The colouring rule was very simple; values
of k below 12, on the outside of the figure, and equal to the
maximum, 200, around the centre, were left blank, while all points
with k between 12 and 199 were printed black. The most interesting
behaviour of both the Mandelbrot and Julia sets is found in and
around the black area.
So let's look at the programs
required to generate fractals. As the systems available to Atari
users will vary, I haven't tried to present a complete program, but
with the comments provided it shouldn't be difficult to modify these
notes to produce a program for your computer.
1) Initial values : ENTER N, M, X0,
Y0, D
The plotting area is assumed to contain N pixels horizontally and M
vertically. X0 and Y0 are the coordinates of the bottom left-hand
corner, and D is the interval between pixels in mathematical units.
I prefer to keep the spacing constant in both directions, but you
can change to different values DX and DY if you wish. It follows
that the upper values of x and y
are
XM=X0+(N-1)*D
YM=Y0+(M-1)*D
and these can alternatively be
entered and D calculated from them.
2) Other values : ENTER P,Q
For the Julia set only, we enter the values for the complex constant
c. For all patterns, we set the value K for the maximum number of
iterations (50 - 1000), and for the maximum amplitude L (10 - 100).
3) For each pixel e.g.
FOR
I=0 TO M-1
FOR
J=0 TO N-1
Set
the loop counter, which gives the value of k, to zero
COUNTER
= 0
Now
set the initial values for z(0) and c.
For
the Mandelbrot set:
XK=0,YK=0
P=X0+J*D
Q=Y0+I*D
For
the Julia set:
XK=X0+J*D
YK=Y0+I*D
(P and Q already set)
Start the iteration and calculate the
next values
START
: XL = XK² - YK² + P
YL
= 2*XK*YK + Q
Increment the counter and reset the
X, Y values for the next stage
COUNTER
= COUNTER + 1
XK
= XL : YK = YL
Loop back if the magnitude of the new
value is less than L, and the maximum number of iterations has not
been reached
IF XK² + YK² < L AND COUNTER
< K THEN GOTO START
4) Colour pixel (I,J) according to
the value of the COUNTER and the colouring rule, usually written as
a set of IF ... THEN statements. Then move on to the next pixel
NEXT
J:NEXT
I
END
Be warned that fractals take an
enormous amount of computing time; 'Sea Creatures' took almost six
days to produce, even with the faster FORTH programming. So it is a
good idea to run the program first with low resolution (N and M), to
see whether it looks interesting, and to improve the resolution when
you have the parameters and the colouring right. It is possible to
store the values of k for smaller patterns, and to study the effects
of different colouring rules, but for large patterns the storage
required, one byte per pixel, becomes excessive.
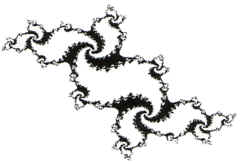
Oriental Design
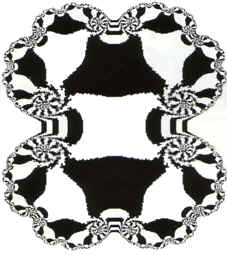
Christmas Decorations
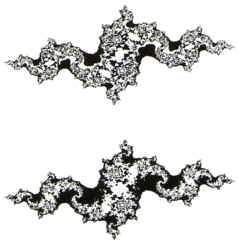
Black Dragons
top